Success Rates 2008-2012-Five Year Averages
Fresh vs Thawed Embryo Transfers (2008 – 2012)
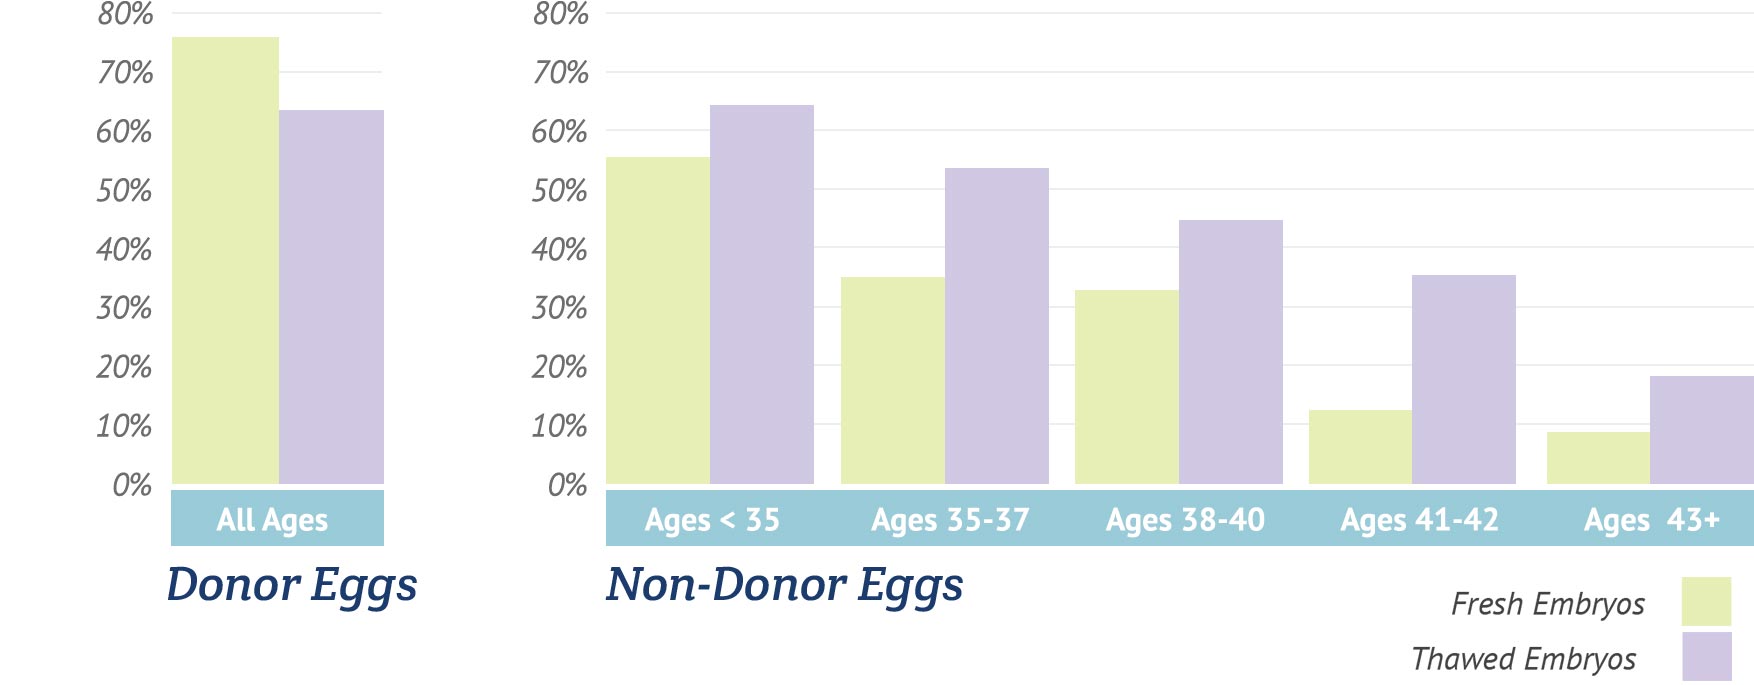
Fresh Embryo Transfers(not using donated eggs)
|
Age <35 |
Age 35-37 |
Age 38-40 |
Age 41-42 |
Age >42 |
|
|
Embryo Transfers |
330 |
158 |
98 |
42 |
21 |
|
Mean # Transferred |
1.8 |
1.8 |
1.7 |
1.7 |
1.76 |
|
Live Birth Rate |
55.5% |
34.8% |
31.6% |
11.9% |
9.5% |
Thawed Embryo Transfers(not using donated eggs)
|
Age <35 |
Age 35-37 |
Age 38-40 |
Age 41-42 |
Age >42 |
|
|
Embryo Transfers |
669 |
276 |
223 |
64 |
26 |
|
Mean # Transferred |
1.7 |
1.7 |
1.8 |
1.7 |
1.8 |
|
Live Birth Rate |
63.2% |
52.9% |
44.4% |
35.9% |
19.2% |
Transfers of Embryos Derived from Donor Eggs
|
Fresh Embryo Transfer |
Thawed Embryo Transfer |
|
|
Embryo Transfers |
156 |
110 |
|
Mean # Transferred |
1.8 |
1.6 |
|
Live Birth Rate |
75.6% |
62.7% |
Did You Know? The Fertility Center of Las Vegas accepts patients with poor prognosis, including those with a history of IVF failure at other centers.
Note: A comparison of clinical success rates may not be meaningful because patient medical characteristics and treatment approaches vary from clinic to clinic.